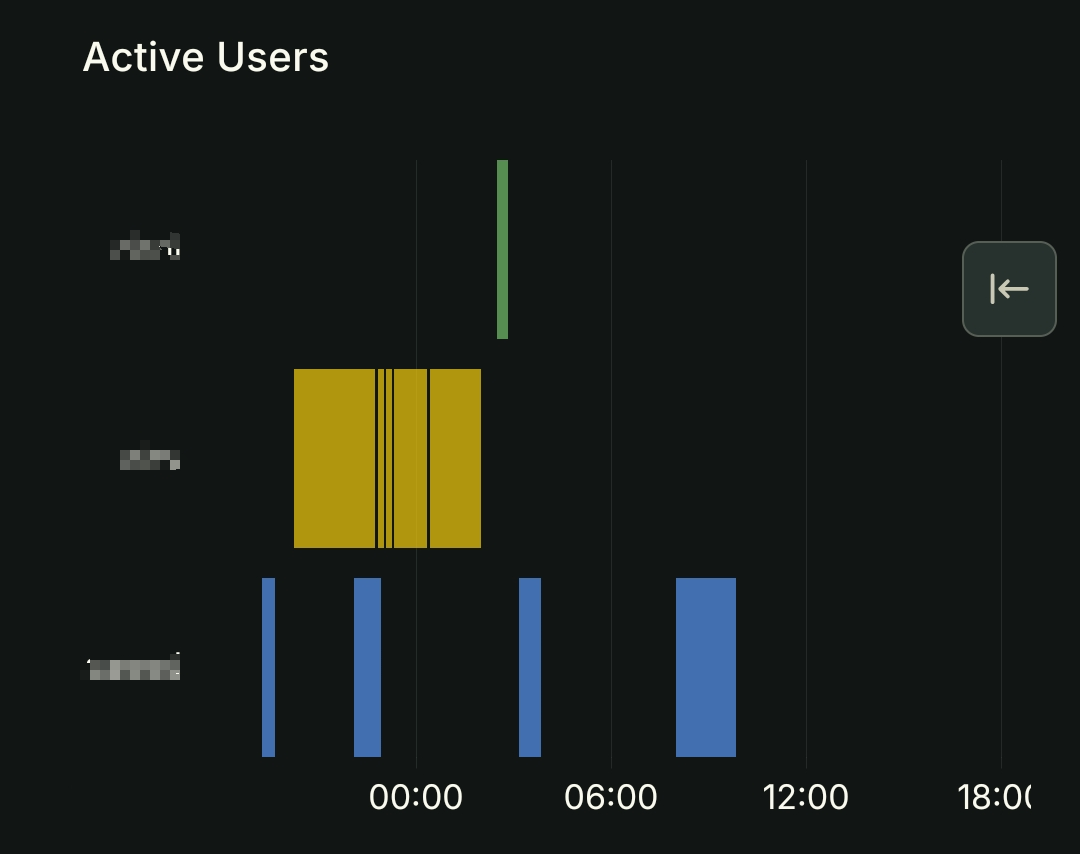
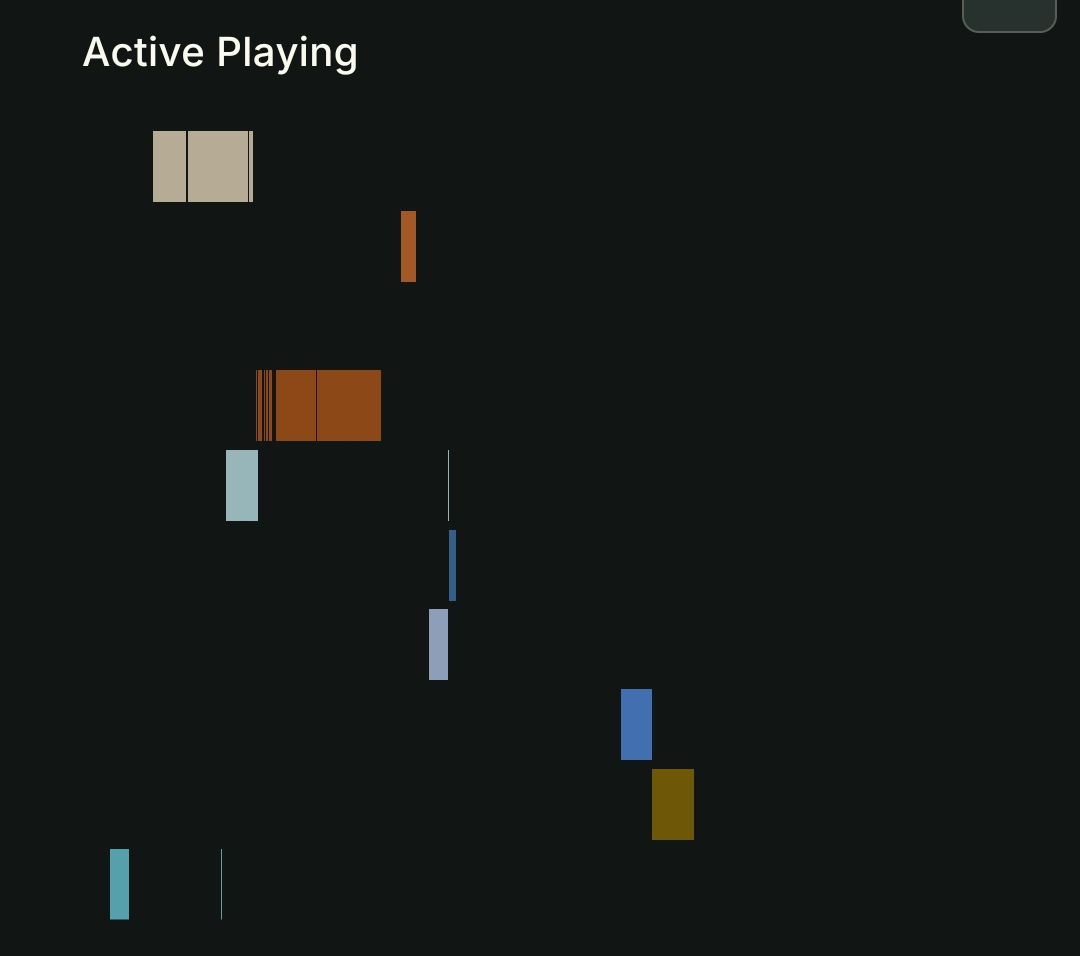
These two are my favourite, first shows active user timeline and second shows active playing timeline (names cut off on mobile). Ideally I would combine them together but have not found a way to do so yet, probably skills issue
Comment on What sort of things do y'all monitor with Grafana / Beszel / etc.?
glorp@lemmy.world 1 week agoWhat kind of visualization is the Jellyfin panel? I’m curious how that data is organized. Torrent monitoring is definitely at the top of the list for Grafana priorities, would be super useful for me
airgapped@piefed.social 1 week ago
airgapped@piefed.social 6 days ago
Sorry for the spam but I in fact managed to join the two panels together. y-axis is users and x-axis is timeline of what they watched. Grafana unfortunately does not natively support different colour for each series block.
image
glorp@lemmy.world 3 days ago
No worries, that’s cool! How did you join them together?
airgapped@piefed.social 3 days ago
Thanks for asking, it took like 6 transforms. I cannot claim to understand them entirely as they are partly vibecoded but the panel works!
image
glorp@lemmy.world 4 hours ago
Neat! I’ve used transforms in a few spots to organize data a bit and join queries in tables, they’re pretty neat. I wouldn’t have figured that out myself either, haha