Comment on What sort of things do y'all monitor with Grafana / Beszel / etc.?
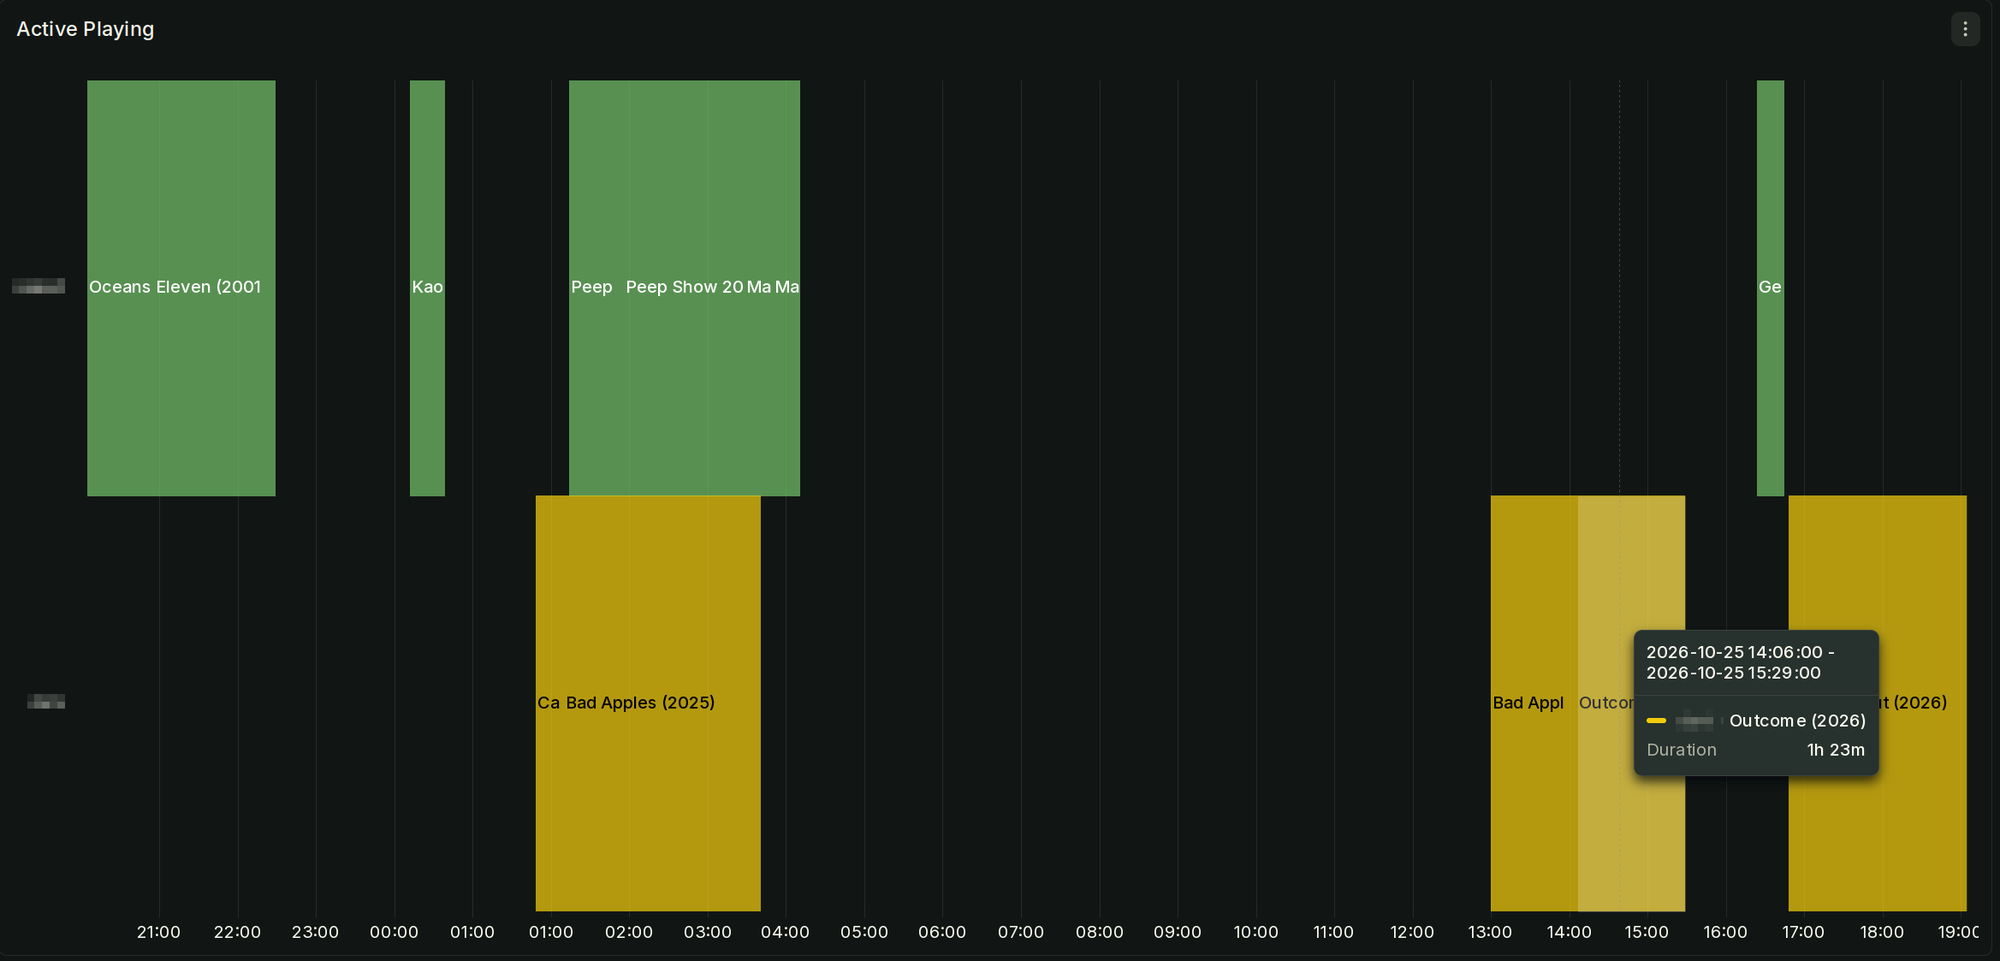
airgapped@piefed.social 6 days agoSorry for the spam but I in fact managed to join the two panels together. y-axis is users and x-axis is timeline of what they watched. Grafana unfortunately does not natively support different colour for each series block.
glorp@lemmy.world 3 days ago
No worries, that’s cool! How did you join them together?
airgapped@piefed.social 3 days ago
Thanks for asking, it took like 6 transforms. I cannot claim to understand them entirely as they are partly vibecoded but the panel works!
image
glorp@lemmy.world 3 hours ago
Neat! I’ve used transforms in a few spots to organize data a bit and join queries in tables, they’re pretty neat. I wouldn’t have figured that out myself either, haha